Practical Wifi Antenna Measurement By PE2ER
|
Antenna characteristics
This page describes a simple way to determine the main RF characteristics of a Wifi (IEEE802.11b/g wireless LAN) antenna. Although this procedure is written specifically with Wifi antennas in mind, it can also be used on other antennas.
-
Voltage Standing Wave Ratio - VSWR
-
Polarisation
-
Maximum Gain
-
-3dB (Half power) Beam width
-
Front to Back ratio
...with relatively simple homebrew equipment:
-
A Wifi SWR/Field strength Meter
-
An RF Generator
-
A High Gain transmit antenna
-
A Reference antenna of known gain
-
An RF Power meter
With this procedure some influences are not taken into account, leading to a reduced measurement accuracy. The results however are accurate enough to compare homebrew antennas and determine if the antenna performs close to the theoretical characteristics or not. When Wifi equipment is used as an RF signal source, the SWR and Field Strength (power) meter must be able to accommodate the pulsed RF signal. My own SWR meter has a Peak-hold circuit for this purpose.
/Antenna measurement results can be recorded in this MS Word form.
Voltage Standng Wave Ratio (VSWR)
 Voltage Standing Wave Ratio (VSWR) is a
measure for how effective an antenna radiates power that is fed to it. The more
power is radiated (and the less power is reflected to the source), the better
the antenna performs. When performing measurements, some RF power is radiated by
the antenna. Power that is reflected back to the antenna by obstacles
influences the measured VSWR. Also power that was radiated by nearby equipment
and received by the antenna influences the measurement. Therefore, it is best
to switch off all equipment that uses an antenna an perform the measurement
outdoors. The procedure that is described below is specific for
my RF Resistance
bridge.
Voltage Standing Wave Ratio (VSWR) is a
measure for how effective an antenna radiates power that is fed to it. The more
power is radiated (and the less power is reflected to the source), the better
the antenna performs. When performing measurements, some RF power is radiated by
the antenna. Power that is reflected back to the antenna by obstacles
influences the measured VSWR. Also power that was radiated by nearby equipment
and received by the antenna influences the measurement. Therefore, it is best
to switch off all equipment that uses an antenna an perform the measurement
outdoors. The procedure that is described below is specific for
my RF Resistance
bridge.
The VSWR of the antenna is determined as follows:
-
First, connect an RF source to the RF Input of the bridge.
-
Switch ON the VSWR meter.
-
Connect a known unmatched load to the Zx port on the bridge like the supplied short circuit connector.
-
Set the Sensitivity control so that the meter indicates the correct VSWR (S for the short circuit)
-
Remove the load from the Zx port on the bridge.
-
Connect the Antenna Under Test (AUT) to the Zx port. Use a single, good quality coupling (Male-N / Male-N or other) as the use of coax cables or inferior RF connectors/ adapters may yield inaccurate measurement results.
Make sure that the area around the antenna is free from obstacles for at least the Rayleigh distance (r = 2 d ²/ Lambda, where d is the dimension of the largest radiating element of the antenna), because obstacles in the reactive (near) field of the antenna can affect the measured VSWR. Mostly, a distance of 2 meters is sufficient for Wifi antennas upto 350mm.
-
Read the antenna's VSWR from the scale on the indicator. Only if a substantial length of coaxial cable is used, the reading needs to be corrected. Refer to the manual for details.
In general, a VSWR between 1:1 and 1:2 is acceptable. A Value below 1:1.5 is good and a value of 1:1 is excellent. SWR However, is not the most important parameter of an antenna. Antenna gain and pattern are. How else are you going to establish if your antenna is an efficient radiator, or just an elaborate air-cooled dummy load?!
Polarisation
Antennas have a polarisation. Polarisation is defined as being the plane of the antennas Electrical field in relation to the earths horizon. Hence, polarisation is dependent on installation. Efficient links are only possible between two antennas of the same polarisation. There are three main polarisation types in use. Horizontal, vertical and Circular. Circular polarisation is further split up into Left Hand Circular and Right Hand Circular Polarisation.
To determine the polarisation of an antenna, simply connect the Antenna Under Test to an RF source. Use a field strength meter to determine the polarisation. Rotate the FS sensor until maximum field strength is obtained. At this point. the polarisation of the antenna equals that of the sensor. Normally, a minimum field strength is observed when the sensor is rotated 90 degrees. When no pronounced maximum or minimum is observed, the AUT has circular polarisation.
Antenna gain and pattern
So, how do we determine the antenna gain with amateur means? Simple, on an antenna range in your backyard!
The principle is straight-forward. An antenna test range is set up with one transmitting antenna, and one receiving. The power received at the antenna is measured. When 'everything else' is known, the receiving antenna gain can be calculated from this.
There are however, a few 'buts' that make antenna measurement not as straight-forward as is described above. The difficulty is to know 'everything else' exactly.
The task can be simplified by a comparison between an unknown antenna and one that has similar properties that are known. Between the measurement of the antenna under test and the reference antenna, 'everything else' is kept constant. It is then only the received power that changes as a function of the antenna gain and pattern. Hence, you can establish the gain of the unknown antenna compared to that of the reference antenna.
This is true only, if a couple of condition are met. And even then, measurement results are never as accurate as those performed with professional equipment in anechoic chambers. But you may expect to have a good idea of the gain of the antenna and its pattern.
Measuring power
The preferred method for measuring power is a Spectrum Analyser. This device gives a graphical and precise view of the power received at a given frequency range. Few amateurs can effort such a device on the hobby budget, and I am not one of them.
I Therefore have to resort to a broadband power sensor, utilising a diode as a detector. The diagram below describes a simple 50 Ohm dummy load/ detector, suitable for use on the 2.4GHz band. Radio Frequency power inputs are converted to Direct Current output voltage. The use of two schottky diodes in a voltage-doubler circuit makes this a sensitive solution: The DC output voltage for a given RF input is proportional to the peak-to-peak voltage minus the voltage drop over the diodes.
The dummy load is comprised of two 100 Ohm SMD resistors. Normally, this has an acceptable SWR on 2.4GHz when mounted correctly. The two diodes however have a negative influence on SWR. My detector has an SWR of 1:3.5 @ 2.4GHz. I Think that this is acceptable for our purpose (but not for absolute power measurements...). The diagram includes the RF2320 amplifier described below.
Another design can be found here http://www.dl5neg.de/. This design exhibits an excellent SWR by isolating the single diode from the RF Input with a 3dB attenuator pad. The 'cost' is a reduced DC Voltage output for a given RF input, so the two antennas on the range must be placed closer to each other when the same Tx power is available.
The DC voltage from the detectors is passed to a High-Z Voltmeter (DMM). Preferably one with a build-in dB calculator or dB scale. You may also calculate the difference between two measurements (in dB) with the following formula:
G = 20 LOG (Uaut/Uref)
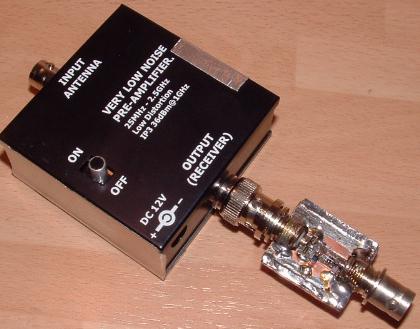
Rx Amplifier
Even with a the sensitive diode detector, sensitivity is a problem. This can be solved by the addition of a pre-amplifier between the antenna under test and the diode detector. I Obtained this RF2320-based amplifier at a Hamfest. It has a gain of approximately 10dB at 2.4GHz.
RF Generator
The RF Field is generated by a small RF generator. In this case, a 2.4GHz 'Audio/ Videolink' model VC35 manufactured by ELRO. I Installed an N-connector receptacle instead of the fixed antenna te be able to connect it to the Tx Antenne described below. The frequency is adjustable between 2400 and 2500 MHz.
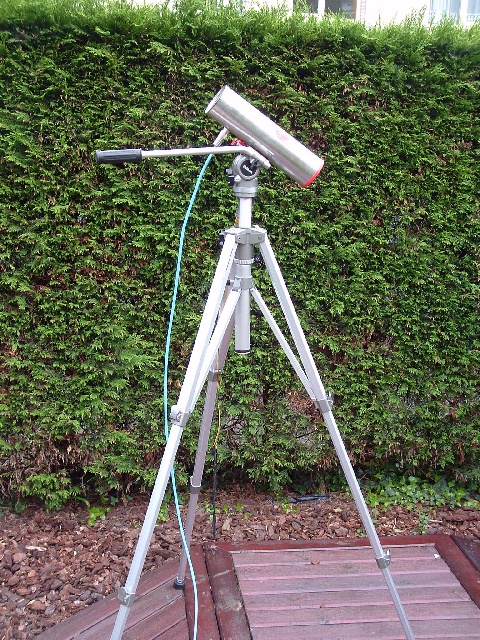
Tx Antenna
The Transmit antenna is placed on the antenna range to illuminate the Antenna Under Test. Ideally, the transmit antenne must have a beam width just wide enough to cover the testrange. Energy transmitted outside this range, will only result in more problems due to multipath reflections.
Measuring Antennas in practice
This procedure describes how to determine the gain and radiation pattern of an antenna.
To determine antenna gain, the field strength generated by the Antenna Under Test (AUT) at a certain distance is measured and compared to the field strength generated by a reference antenna with known gain. To minimise errors, the reference antenna must have approximately the same gain as is expected for the AUT.
To determine the radiation pattern of the AUT, the field strength is measured at a fixed distance while the antenna is rotated through 360 degrees. Data is collected at specific point in order to determine the pattern
The measurement is performed outdoors, and requires a field free of obstacles. The antenna range setup is drawn below.
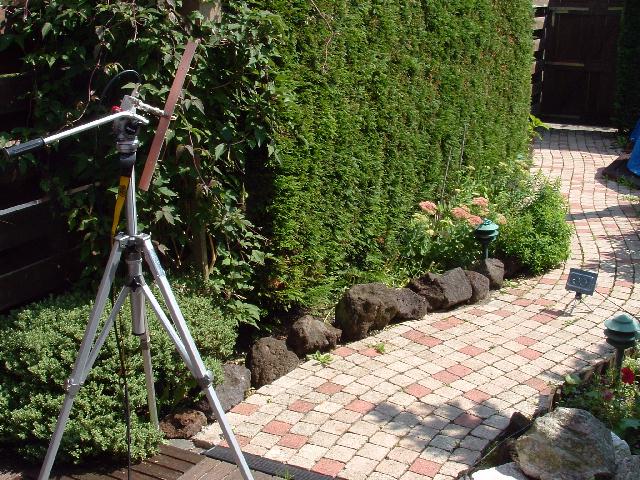
Antenna measurement with too many obstacles in my garden
About the antenna range
Choose the antenna range with care. There should be as little obstacles near the range as possible. The ground should preferably be of one nature between the two antennas. A grass lawn is perfect in this respect.
The distance Smin between the Field strength Sensor (FS) and the AUT is large enough to be in the far field (Rayleigh Distance), but close enough to generate a substantial DC voltage in the FS. If FS sensitivity permits, the distance can be increased to improve measurement accuracy.
The Tx antenna will produce a field strength (FS) at the AUT, that varies with the height of the Tx antenna and AUT. The Tx antenna is placed at a height H1, that produces a maximum Field Strength at the AUT at height H2. For this, place the Tx antenne in the position closest to the ground and raise the Tx antenna until the first maximum FS appears at the AUT.
The position of the Tx antenna and AUT is chosen in a manner to minimise the influence of ground and obstacle reflections on the measurement.
Equipment
This may be like kicking-in an open door - I sure hope that it is: When performing antenna measurements, use only equipment, cables, connectors and adapters suitable for the frequency at which the measurement is performed. This is especially true for the 2,4GHz ISM band. Do not use cheap cable, connector and adapters for you risk chasing after 'ghosts', trying to make sense of incoherent measurement results :(
Calibration of the range
Before measurement of the AUT, the antenna range must be calibrated. Select a reference antenna with slightly higher gain than expected for the AUT. To calibrate, place the reference antenna on the tripod. Adjust the pan and tilt to get maximum FS.
-
Without the RF generator switched OFF, read the indicated Field strength with the Sensitivity of the meter set to maximum. The meter should not indicate any Field Strength.
-
Switch ON the RF generator.
-
Adjust the position of the Reference antenna and Tx Antenna so that the maximum field strength is indicated on the FS meter.
-
Next, set the FS meter to 0dB with the Sensitivity control.
-
This arrangement should provide an area of relative constant Field Strength around the AUT (The orange area on the schematic of the range shown above). Within this area, you should be able to change the position of the Reference Antenna with the Field Strength remaining stable to within +/- 1dB.
Antenna Gain
-
 Put the AUT in place of the Reference Antenna. Make sure
that the focal point of the antenna is in approximately the same position as that of the
reference antenna in relation to the Tx Antenna.
Put the AUT in place of the Reference Antenna. Make sure
that the focal point of the antenna is in approximately the same position as that of the
reference antenna in relation to the Tx Antenna. -
Adjust position of the AUT to get a maximum reading on the Field Strength meter. The (negative) Relative Field Strength value indicated is a measure for the difference in gain between the RA and AUT.
Gain (AUT) = Gain (RA) + RFS(AUT).
For example:
-
Gain of the reference antenna = 14dBi
-
Relative Field Strength = -2.5dB
-
Gain of AUT = 14dBi + -2.5dB = 11.5dBi
If a G(RA) < G(AUT) then use the AUT as reference, and determine the Relative Field Strength of the Reference Antenna. Gain (AUT) = Gain (RA) - RFS(RA).
Antenna -3dB Beam width
An antenna pattern for a directional antenna mostly consists of one main beam and some sidelobes. It is good to know the -3dB (Half Power) beam width of the main beam, it gives an idea of the area that can be served by the antenna. This is the width of the main Beam, expressed in degrees, between the two points where the field strength is 3dB below the maximum field strength in the center of the beam. To measure the angle, you need a protractor on the antenna mount.
-
With the AUT in place, adjust position of the AUT to get a maximum reading on the Field Strength meter.
-
Set the FS meter to 0dB with the Sensitivity control - this is the 0dB reference.
-
Set the protractor to read 0° - this is the antenna boresight reference.
-
Now rotate the antenna left, until the F/S meter indicates -3dB. Record the angle of the antenna on the protractor (for example: -32°)
-
Now rotate the antenna right, past the 0° mark, until the F/S meter indicates -3dB. Record the angle of the antenna on the protractor (for example: +28°)
-
The -3dB beam width is the width between the two measured angles ( 32° + 28° = 60°)
Antenna Front to Back (F/B) ratio
Another antenna parameter of interest is the front to back ratio. It is a measure for how efficient the antenna directs its energy forward (and not backwards). To determine the F/B ratio, do as follows:
-
With the AUT in place, adjust position of the AUT to get a maximum reading on the Field Strength meter.
-
Set the FS meter to 0dB with the Sensitivity control - this is the 0dB reference.
-
Turn the AUT 180°. The rear of the antenna now faces the field strength meter.
-
Read the value on the field strength meter. The meter now shows the F/B ratio in dB.
Antenna pattern
Finally, the antenna pattern. This is a graphic representation of the field stength generated around the antenna. The best way to record this, is to use an automated test setup, where a rotor drives the antenna over a range of 360°. Record the relative field strength for each angle and display it in a graph. It is also possible to accomplish similar results without the use of expensive equipment. By simply rotating the antenna by hand, a good idea of the antenna pattern can be gained.
-
With the AUT in place, adjust position of the AUT to get a maximum reading on the Field Strength meter.
-
Set the FS meter to 0dB with the Sensitivity control - this is the 0dB reference. Record this point on this MS Word form.
-
Turn the AUT 15° clockwise.
-
Read the value on the field strength meter. Record this value on this MS Word form.
-
Repeat this, until the antenna has made a full 360° turn.
In addition to this, note down the value and angle of minima and maxima of the field strength, even if these lay in between the 15° increments.
Copyright: Erwin Gijzen (PE2ER)
Links:
http://www.wirelessnederland.nl Wireless Nederland – Dutch Authority on Wifi
http://www.dl5neg.de/ Various HAM Radio projects, including a power sensor and digital power display.
 Copyright: Erwin Gijzen